
Envoy statistics with StatsD
For an overview of other options for gathering statistics on Ambassador, see the Statistics and Monitoring overview.
At the core of Ambassador is Envoy Proxy, which has built-in support for exporting a multitude of statistics about its own operations to StatsD (or to the modified DogStatsD used by Datadog).
If enabled, then Ambassador has Envoy expose this information via the
ubiquitous and well-tested StatsD
protocol. To enable this, you will simply need to set the environment
variable STATSD_ENABLED=true in Ambassador's deployment YAML:
spec:containers:- env:+ - name: STATSD_ENABLED+ value: "true"- name: AMBASSADOR_NAMESPACEvalueFrom:fieldRef:
When this variable is set, Ambassador by default sends statistics to a
Kubernetes service named statsd-sink on UDP port 8125 (the usual
port of the StatsD protocol). You may instead tell Ambassador to send
the statistics to a different StatsD server by setting the
STATSD_HOST environment variable. This can be useful if you have an
existing StatsD sink available in your cluster.
We have included a few example configurations in the
statsd-sink/ directory to help you get started. Clone the
repository to get local, editable copies.
Using Graphite as the StatsD sink
Graphite is a web-based real-time graphing system. Spin up an example Graphite setup:
kubectl apply -f statsd-sink/graphite/graphite-statsd-sink.yaml
This sets up the statsd-sink service and a deployment that contains
Graphite and its related infrastructure. Graphite's web interface is
available at http://statsd-sink/ from within the cluster. Use port
forwarding to access the interface from your local machine:
SINKPOD=$(kubectl get pod -l service=statsd-sink -o jsonpath="{.items[0].metadata.name}")kubectl port-forward $SINKPOD 8080:80
This sets up Graphite access at http://localhost:8080/.
Using Prometheus StatsD Exporter as the StatsD sink
Ambassador has an endpoint that has exposes statistics in a format that Prometheus understands natively. If you're using Prometheus, we recommend configuring Prometheus to talk to the
:8877/metricsendpoint directly, instead of instead of going through StatsD and a translator.
Prometheus is an open-source monitoring and alerting system.
Prometheus does not natively understand the StatsD protocol, but you
can deploy the Prometheus StatsD Exporter to act as the StatsD
sink, and it will translate from StatsD to the exposition format
that Prometheus requires. An example of how deploying Prometheus
StatsD Exporter is available in prom-statsd-sink.yaml.
To finally get the statistics to Prometheus, you then configure a
Prometheus target to read from statsd-sink on port 9102.
You could instead add the statsd-sink service and Prometheus StatsD
Exporter as a sidecar on the Ambassador pod. If you do this, make
sure to set STATSD_HOST=localhost so that UDP packets are routed to
the sidecar.
Configuring how Prometheus StatsD Exporter translates from StatsD to the Prometheus format
It may be desirable to change how metrics produced by the
statsd-sink are named, labeled and grouped when they finally make it
to Prometheus.
For example, by default, each service that Ambassador serves will
create a new metric using its name. For the service called usersvc
you will see this metric
envoy.cluster.usersvc_cluster.upstream_rq_total. This may lead to
problems if you are trying to create a single aggregate that is the
sum of all similar metrics from different services. In this case, it
is common to differentiate the metrics for an individual service with
a label. This can be done by configuring a Prometheus StatsD
Exporter "mapping" (not to be confused with an Ambassador
"Mapping"). See Metric Mapping and Configuration in
the Prometheus StatsD Exporter documentation to learn how to modify
its mappings.
Configuring Prometheus StatsD Exporter with Helm
If you deploy Prometheus using Helm the value that you should change
in order to add a mapping is prometheusExporter.configuration. Set
it to something like this:
configuration: |---mappings:- match: 'envoy.cluster.*.upstream_rq_total'name: "envoy_cluster_upstream_rq_total"timer_type: 'histogram'labels:cluster_name: "$1"
Configuring Prometheus StatsD Exporter with kubectl
In the ambassador-rbac-prometheus.yaml example template there is
a ConfigMap that should be updated. Add your mapping to the
configuration property.
---apiVersion: v1kind: ConfigMapmetadata:name: ambassador-configdata:exporterConfiguration: |---mappings:- match: 'envoy.cluster.*.upstream_rq_total'name: "envoy_cluster_upstream_rq_total"timer_type: 'histogram'labels:cluster_name: "$1"
Using the Prometheus Operator to configure Prometheus for use with the Prometheus StatsD Exporter
If you don't already have a Prometheus setup, the Prometheus Operator is a powerful way to create and deploy Prometheus instances. Use the following YAML to quickly configure the Prometheus Operator with Ambassador:
statsd-sink.yamlCreates the Prometheus Stats Exporter deployment andstatsd-sinkservice that receives the statistics from Ambassador and translates them to Prometheus metrics. It also creates aServiceMonitorresource that tells the Prometheus Operator to configure Prometheus to fetch those metrics from the StatsD Exporter.prometheus.yamlDeploys the Prometheus Operator and createsPrometheusresource that tells the Prometheus Operator to create the actual Prometheus deployment.
Make sure that the ServiceMonitor is in the same namespace as
Ambassador. A walk-through of the basics of configuring the
Prometheus Operator with Ambassador is available
here.
Ensure STATSD_ENABLED is set to "true" and apply the YAML with
kubectl:
kubectl apply -f statsd-sink.yamlkubectl apply -f prometheus.yaml
Wait for a minute after the pods spin up and then access the
Prometheus dashboard by port-forwarding the Prometheus pod and going
to http://localhost:9090/ on a web-browser.
kubectl port-forward prometheus-prometheus-0 9090
Using Grafana to visualize statistics gathered by Prometheus
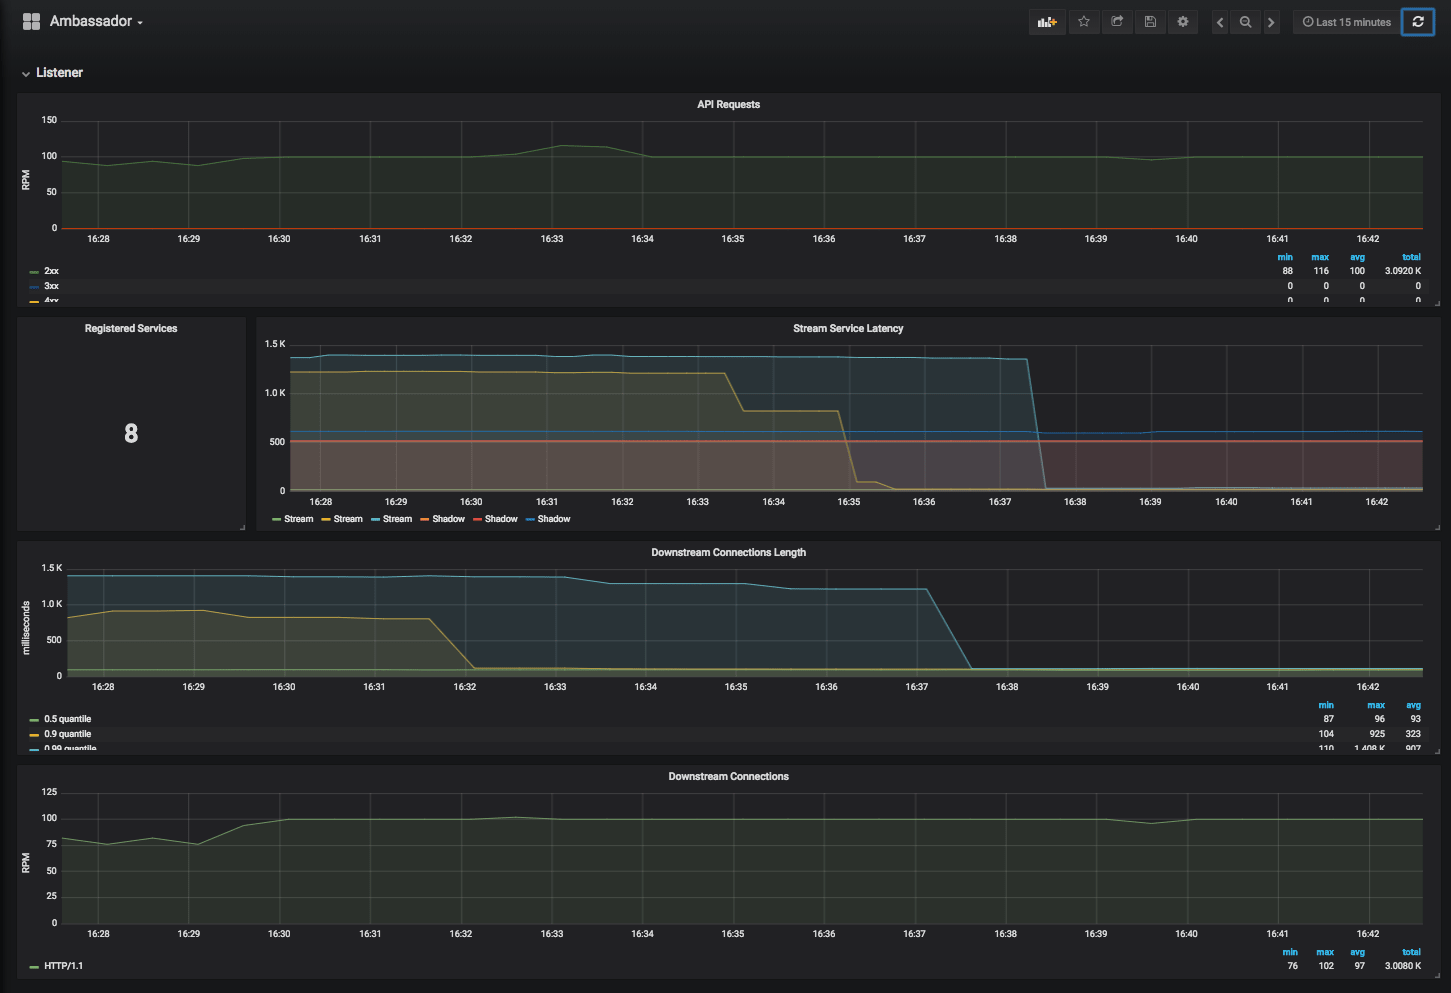
If you're using Grafana, Alex Gervais has written a template
Ambassador dashboard for Grafana that works with either the
metrics exposed by the Prometheus StatsD Exporter, or by the
:8877/metrics endpoint.
Using Datadog DogStatsD as the StatsD sink
If you are a user of the Datadog monitoring system, pulling in the Envoy statistics from Ambassador is very easy.
Because the DogStatsD protocol is slightly different than the normal
StatsD protocol, in addition to setting Ambassador's
STATSD_ENABLED=true environment variable, you also need to set the
DOGSTATSD=true environment variable:
spec:containers:- env:+ - name: STATSD_ENABLED+ value: "true"+ - name: DOGSTATSD+ value: "true"- name: AMBASSADOR_NAMESPACEvalueFrom:fieldRef:
Then, you will need to deploy the DogStatsD agent in to your cluster to act as the StatsD sink. To do this, replace the sample API key in our sample YAML file with your own, then apply that YAML:
kubectl apply -f statsd-sink/datadog/dd-statsd-sink.yaml
This sets up the statsd-sink service and a deployment of the
DogStatsD agent that forwards the Ambassador statistics to your
Datadog account.
Questions?
We’re here to help. If you have questions, join our Slack or contact us.