
The :8877/metrics endpoint
For an overview of other options for gathering statistics on Ambassador, see the Statistics and Monitoring overview.
Each Ambassador pod exposes statistics and metrics for that pod at
http://{POD}:8877/metrics. The response is in the text-based
Prometheus exposition format.
Understanding the statistics
The Prometheus exposition format includes special "HELP" lines that make the file self-documenting as to what specific statistics mean.
envoy_*: See the Envoy documentation.ambassador_*(new in 1.7.0):ambassador_edge_stack_*(not present in Ambassador API Gateway):ambassador_edge_stack_go_*: See [promethus.NewGoCollector()][].ambassador_edge_stack_promhttp_*Seepromhttp.Handler().ambassador_edge_stack_process_*: See [promethus.NewProcessCollector()][]..
ambassador_*_time_seconds(for*= one ofaconf,diagnostics,econf,fetcher,ir, orreconfiguration): Gauges of how long the various core operations take in the diagd process.ambassador_diagnostics_(errors|notices): The number of diagnostics errors and notices that would be shown in the diagnostics UI or the Edge Policy Console.ambassador_diagnostics_info: Info about the Ambassador install; all information is presented in labels; the value of the Gauge is always "1".ambassador_process_*: Seeprometheus_client.ProcessCollector.
Polling the :8877/metrics endpoint with Prometheus
To scrape metrics directly, follow the instructions for Monitoring with Prometheus and Grafana.
Using Grafana to visualize statistics gathered by Prometheus
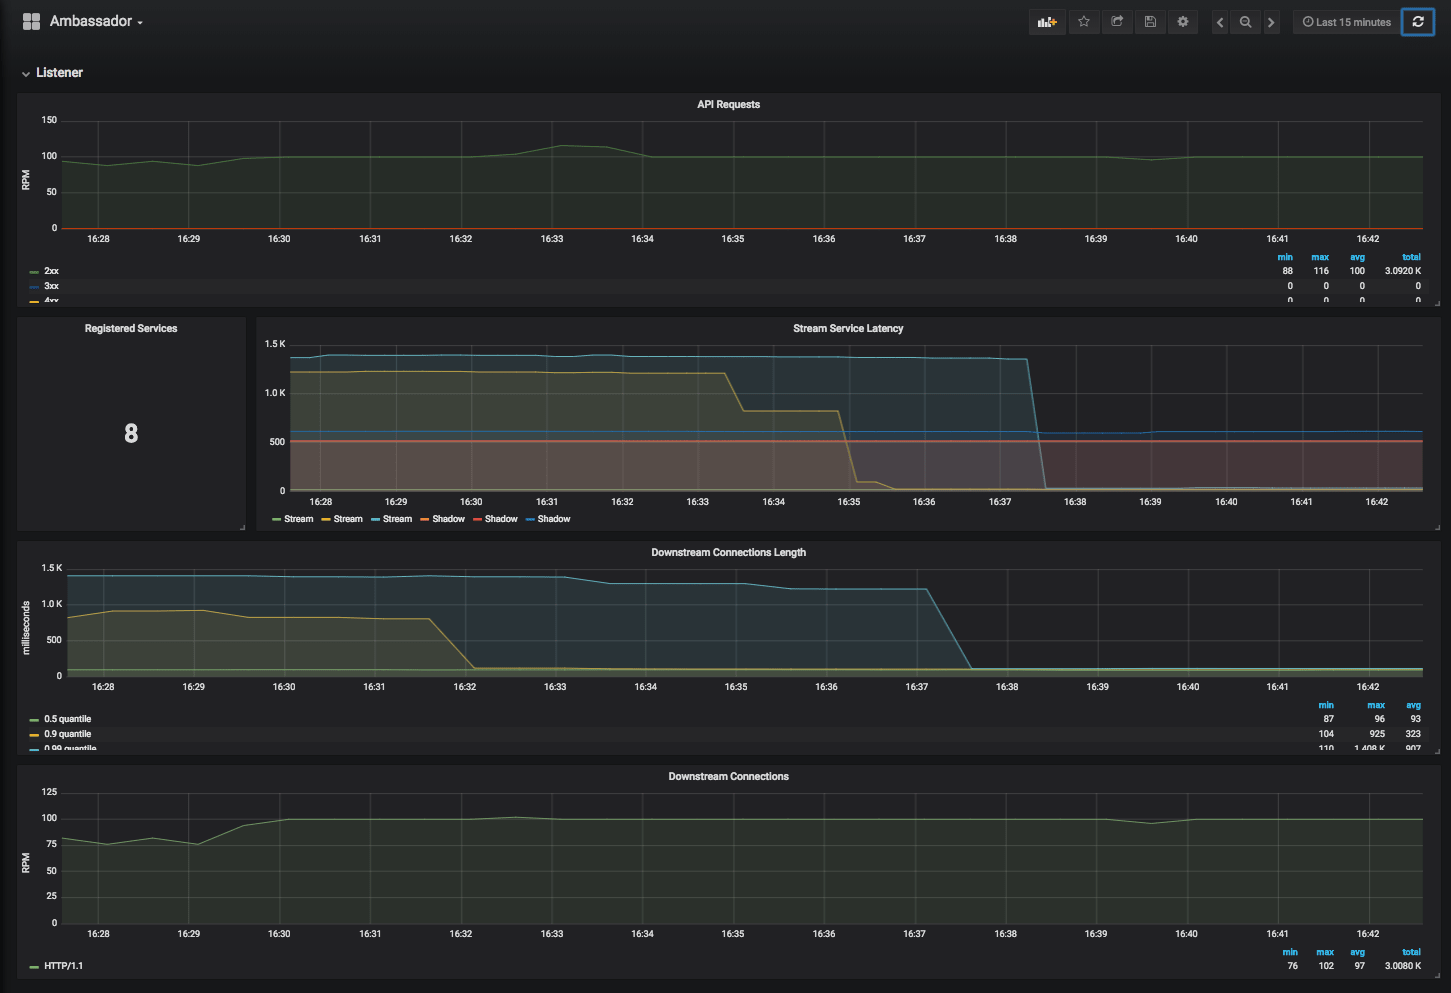
Sample dashboard
We provide a sample Grafana dashboard
that displays information collected by Prometheus from the
:8877/metrics endpoint.
Just Envoy information
Alex Gervais has written a template Ambassador dashboard for
Grafana that displays information collected by Prometheus either
from the :8877/metrics endpoint, or from Envoy over
StatsD. Because it is designed to work with
the Envoy StatsD set up, it does not include any of the ambassador_*
statistics; because of this, we recommend using the other sample
dashboard above.
Questions?
We’re here to help. If you have questions, join our Slack or contact us.