
Statistics and Monitoring
Ambassador Edge Stack uses Envoy Proxy, which has Observability to expose a multitude of statistics about its own operations. You can use the Envoy /metrics endpoint to scrap states and metrics directly, so you don't need to configure your Ambassador Edge Stack to output statistics to another tool, such as StatsD.
To scrape metrics directly, follow the instructions for Monitoring with Prometheus and Grafana.
Ambassador Edge Stack makes it easy to direct this information to a statistics and monitoring tool of your choice. As an example, for a given service usersvc, here are some interesting statistics to investigate:
envoy.cluster.usersvc_cluster.upstream_rq_totalis the total number of requests thatusersvchas received via Ambassador Edge Stack. The rate of change of this value is one basic measure of service utilization, i.e. requests per second.envoy.cluster.usersvc_cluster.upstream_rq_2xxis the total number of requests to whichusersvcresponded with an HTTP response indicating success. This value divided by the prior one, taken on an rolling window basis, represents the recent success rate of the service. There are corresponding4xxand5xxcounters that can help clarify the nature of unsuccessful requests.envoy.cluster.usersvc_cluster.upstream_rq_timeis a StatsD timer that tracks the latency in milliseconds ofusersvcfrom Ambassador Edge Stack's perspective. StatsD timers include information about means, standard deviations, and decile values.
Exposing Statistics via StatsD
Statistics can be exposed via the ubiquitous and well-tested StatsD protocol.
To expose statistics via StatsD, you will need to set an environment variable STATSD_ENABLED: true in Ambassador Edge Stack's deployment YAML.
<redacted>spec:containers:- env:- name: STATSD_ENABLEDvalue: "true"- name: AMBASSADOR_NAMESPACEvalueFrom:fieldRef:apiVersion: v1fieldPath: metadata.namespaceimage: <ambassador image>imagePullPolicy: IfNotPresent<redacted>
When this variable is set, Ambassador Edge Stack automatically sends statistics information to a Kubernetes service called statsd-sink using typical StatsD protocol settings, UDP to port 8125. You may also override the StatsD host by setting the STATSD_HOST environment variable. This can be useful if you have an existing StatsD sink available in your cluster.
We have included a few example configurations in the statsd-sink subdirectory to help you get started. Clone the repository to get local, editable copies.
Graphite
Graphite is a web-based realtime graphing system. Spin up an example Graphite setup:
kubectl apply -f statsd-sink/graphite/graphite-statsd-sink.yaml
This sets up the statsd-sink service and a deployment that contains Graphite and its related infrastructure. Graphite's web interface is available at http://statsd-sink/ from within the cluster. Use port forwarding to access the interface from your local machine:
SINKPOD=$(kubectl get pod -l service=statsd-sink -o jsonpath="{.items[0].metadata.name}")kubectl port-forward $SINKPOD 8080:80
This sets up Graphite access at http://localhost:8080/.
Prometheus
Prometheus is an open-source monitoring and alerting system. If you use Prometheus, you can use the /metrics endpoint for scraping metrics directly from the Ambassador admin port (:8877), or deploy the Prometheus StatsD Exporter as the statsd-sink service. The latter will translate StatsD metrics into Prometheus metrics; configure a Prometheus target to read from statsd-sink on port 9102 to complete the Prometheus configuration. A sample configuration for Prometheus is available here.
You can optionally also add the statsd-sink service and Prometheus exporter as a sidecar on the Ambassador Edge Stack pod. If you do this, make sure to set STATSD_HOST: localhost so that UDP packets are routed to the sidecar.
Configuring Metrics Mappings for Prometheus
It may be desirable to change how metrics produced by the statsd-sink are named, labeled and grouped.
For example, by default, each service that the API Gateway serves will create a new metric using its name. For the service called usersvc you will see this metric: envoy.cluster.usersvc_cluster.upstream_rq_total. This may lead to problems if you are trying to create a single aggregate that is the sum of all similar metrics from different services. In this case, it is common to differentiate the metrics for an individual service with a label. This can be done using a mapping.
Follow this guide to learn how to modify your mappings.
Configuring for Helm
If you deploy Prometheus using Helm the value that you should change is prometheusExporter.configuration. Set it to something like this:
configuration: |---mappings:- match: 'envoy.cluster.*.upstream_rq_total'name: "envoy_cluster_upstream_rq_total"timer_type: 'histogram'labels:cluster_name: "$1"
Configuring for kubectl
In the ambassador-rbac-prometheus.yaml example template there is a ConfigMap that should be updated. Add your mapping to the configuration property.
---apiVersion: v1kind: ConfigMapmetadata:name: ambassador-configdata:exporterConfiguration: |---mappings:- match: 'envoy.cluster.*.upstream_rq_total'name: "envoy_cluster_upstream_rq_total"timer_type: 'histogram'labels:cluster_name: "$1"
The Prometheus Operator
If you don't already have a Prometheus setup, the Prometheus operator is a powerful way to create and deploy Prometheus instances. Use the following YAML to quickly configure the Prometheus Operator with Ambassador Edge Stack:
statsd-sink.yamlCreates thestatsd-sinkservice that collects stats date from Ambassador Edge Stack and translates it to Prometheus metrics. It also creates aServiceMonitorthat addsstatsd-sinkas a Prometheus target.prometheus.yamlDeploys the Prometheus Operator and creates aPrometheusobject that collects data from the location defined by theServiceMonitor.
Make sure that the ServiceMonitor is in the same namespace as Ambassador Edge Stack. A walk-through of the basics of configuring the Prometheus operator with Ambassador Edge Stack and Envoy is available here.
Ensure STATSD_ENABLED is set to "true" and apply the YAML with kubectl.
kubectl apply -f statsd-sink.yamlkubectl apply -f prometheus.yaml
Wait for a minute after the pods spin up and then access the Prometheus dashboard by port-forwarding the Prometheus pod and going to http://localhost:9090/ on a web-browser.
kubectl port-forward prometheus-prometheus-0 9090
StatsD as an Independent Deployment
If you want to set up the StatsD sink as an independent deployment, this example configuration mirrors the Graphite and Datadog configurations.
Grafana
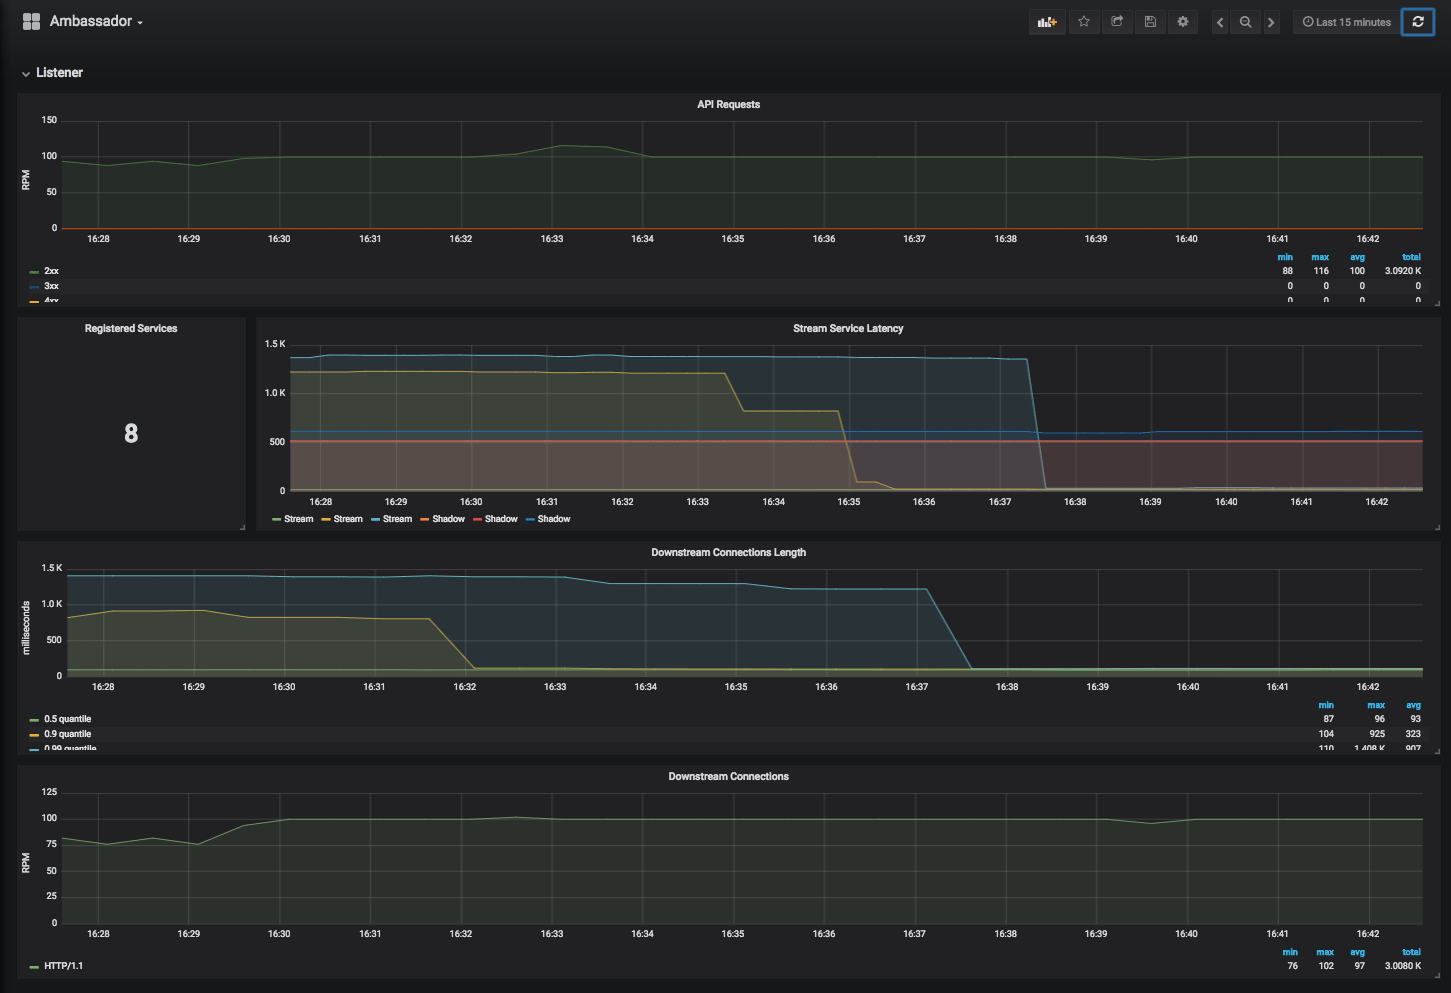
If you're using Grafana, Alex Gervais has written a template Grafana dashboard for Ambassador Edge Stack.
Datadog
If you are a user of the Datadog monitoring system, pulling in Ambassador Edge Stack statistics is very easy. Replace the sample API key in the YAML file with your own, then launch the DogStatsD agent:
kubectl apply -f statsd-sink/datadog/dd-statsd-sink.yaml
This sets up the statsd-sink service and a deployment of the DogStatsD agent that automatically forwards Ambassador Edge Stack stats to your Datadog account.
Next, add the DOGSTATSD environment variable to your deployment to tell Envoy to emit stats with DogStatsD-compliant tags:
<redacted>spec:containers:- env:- name: STATSD_ENABLEDvalue: "true"- name: DOGSTATSDvalue: "true"- name: AMBASSADOR_NAMESPACEvalueFrom:fieldRef:apiVersion: v1fieldPath: metadata.namespaceimage: <ambassador image>imagePullPolicy: IfNotPresent<redacted>
Questions?
We’re here to help. If you have questions, join our Slack or contact us.